Manipulating Spectra
Interactive Phasing of Spectra
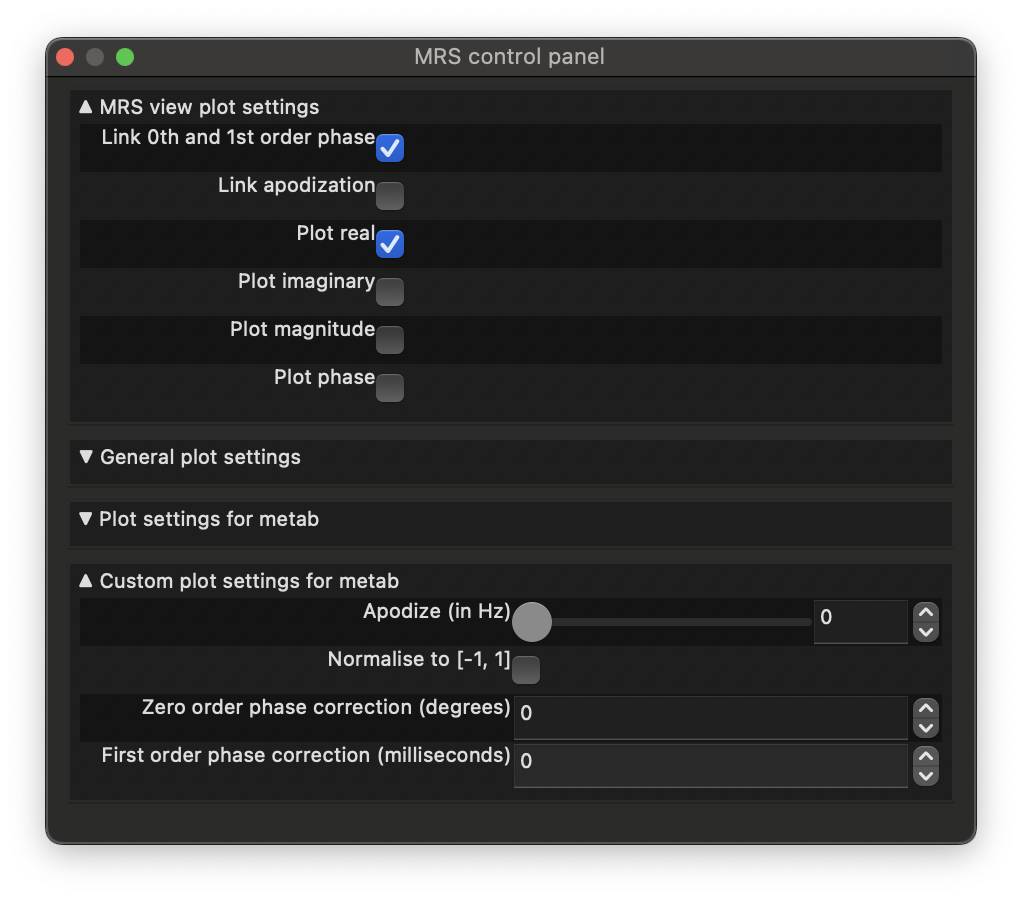
Phasing of spectra can be carried out manually using the MRS View control panel
(open with  , or by the Settings -> MRS {N} -> MRS control menu option).
Zero and first-order phase can be applied using the relevant fields in the menu.
, or by the Settings -> MRS {N} -> MRS control menu option).
Zero and first-order phase can be applied using the relevant fields in the menu.
Phase will be applied simultaneously to all spectra in the MRS view if the Link 0th and 1st order phase check-box is enabled. If disabled, then different phase can be applied to a single spectrum by selecting the spectrum in the Overlay List panel.
Phasing can also be carried out interactively in the MRS View. To do this, left click and pan whilst holding the control or shift (or both) keys to apply zero-order or first-order phase, respectively (or both together). As above, all spectra will be phase simultaneously if the Link 0th and 1st order phase check-box is enabled in the control panel. Left and right click without any modifier keys will pan and zoom the spectrum view respectively.
Key Combination |
Action |
|---|---|
Left click (l/r/u/d) |
Pan view |
Right click (l/r/u/d) |
Zoom view |
Left click (l/r) + ctrl |
Zero-order phase |
Left click (u/d) + shift |
First-order phase |
Left click (l/r/u/d) + ctrl + shift |
Zero- and first-order phase |
Apodizing Spectra
An apodization (i.e. exponential time domain filter) can be applied to the spectra, to decrease the visual effect of noise on a spectrum. This can be applied by using the Apodize (in Hz) slider in the control panel. To apodize all spectra together, check the Link apodization box.
Pinning Multiple Spectra
Multiple spectra from the same or different datasets can be compared directly in the MRS view by pinning the currently displayed spectrum using the Plot list panel.
Clicking the ‘+’ button on either the Plot list panel or the main MRS view toolbar will hold a spectrum (and add it to the list of displayed spectra in the Plot list panel). Pinned spectra can be removed using the ‘-’ button.
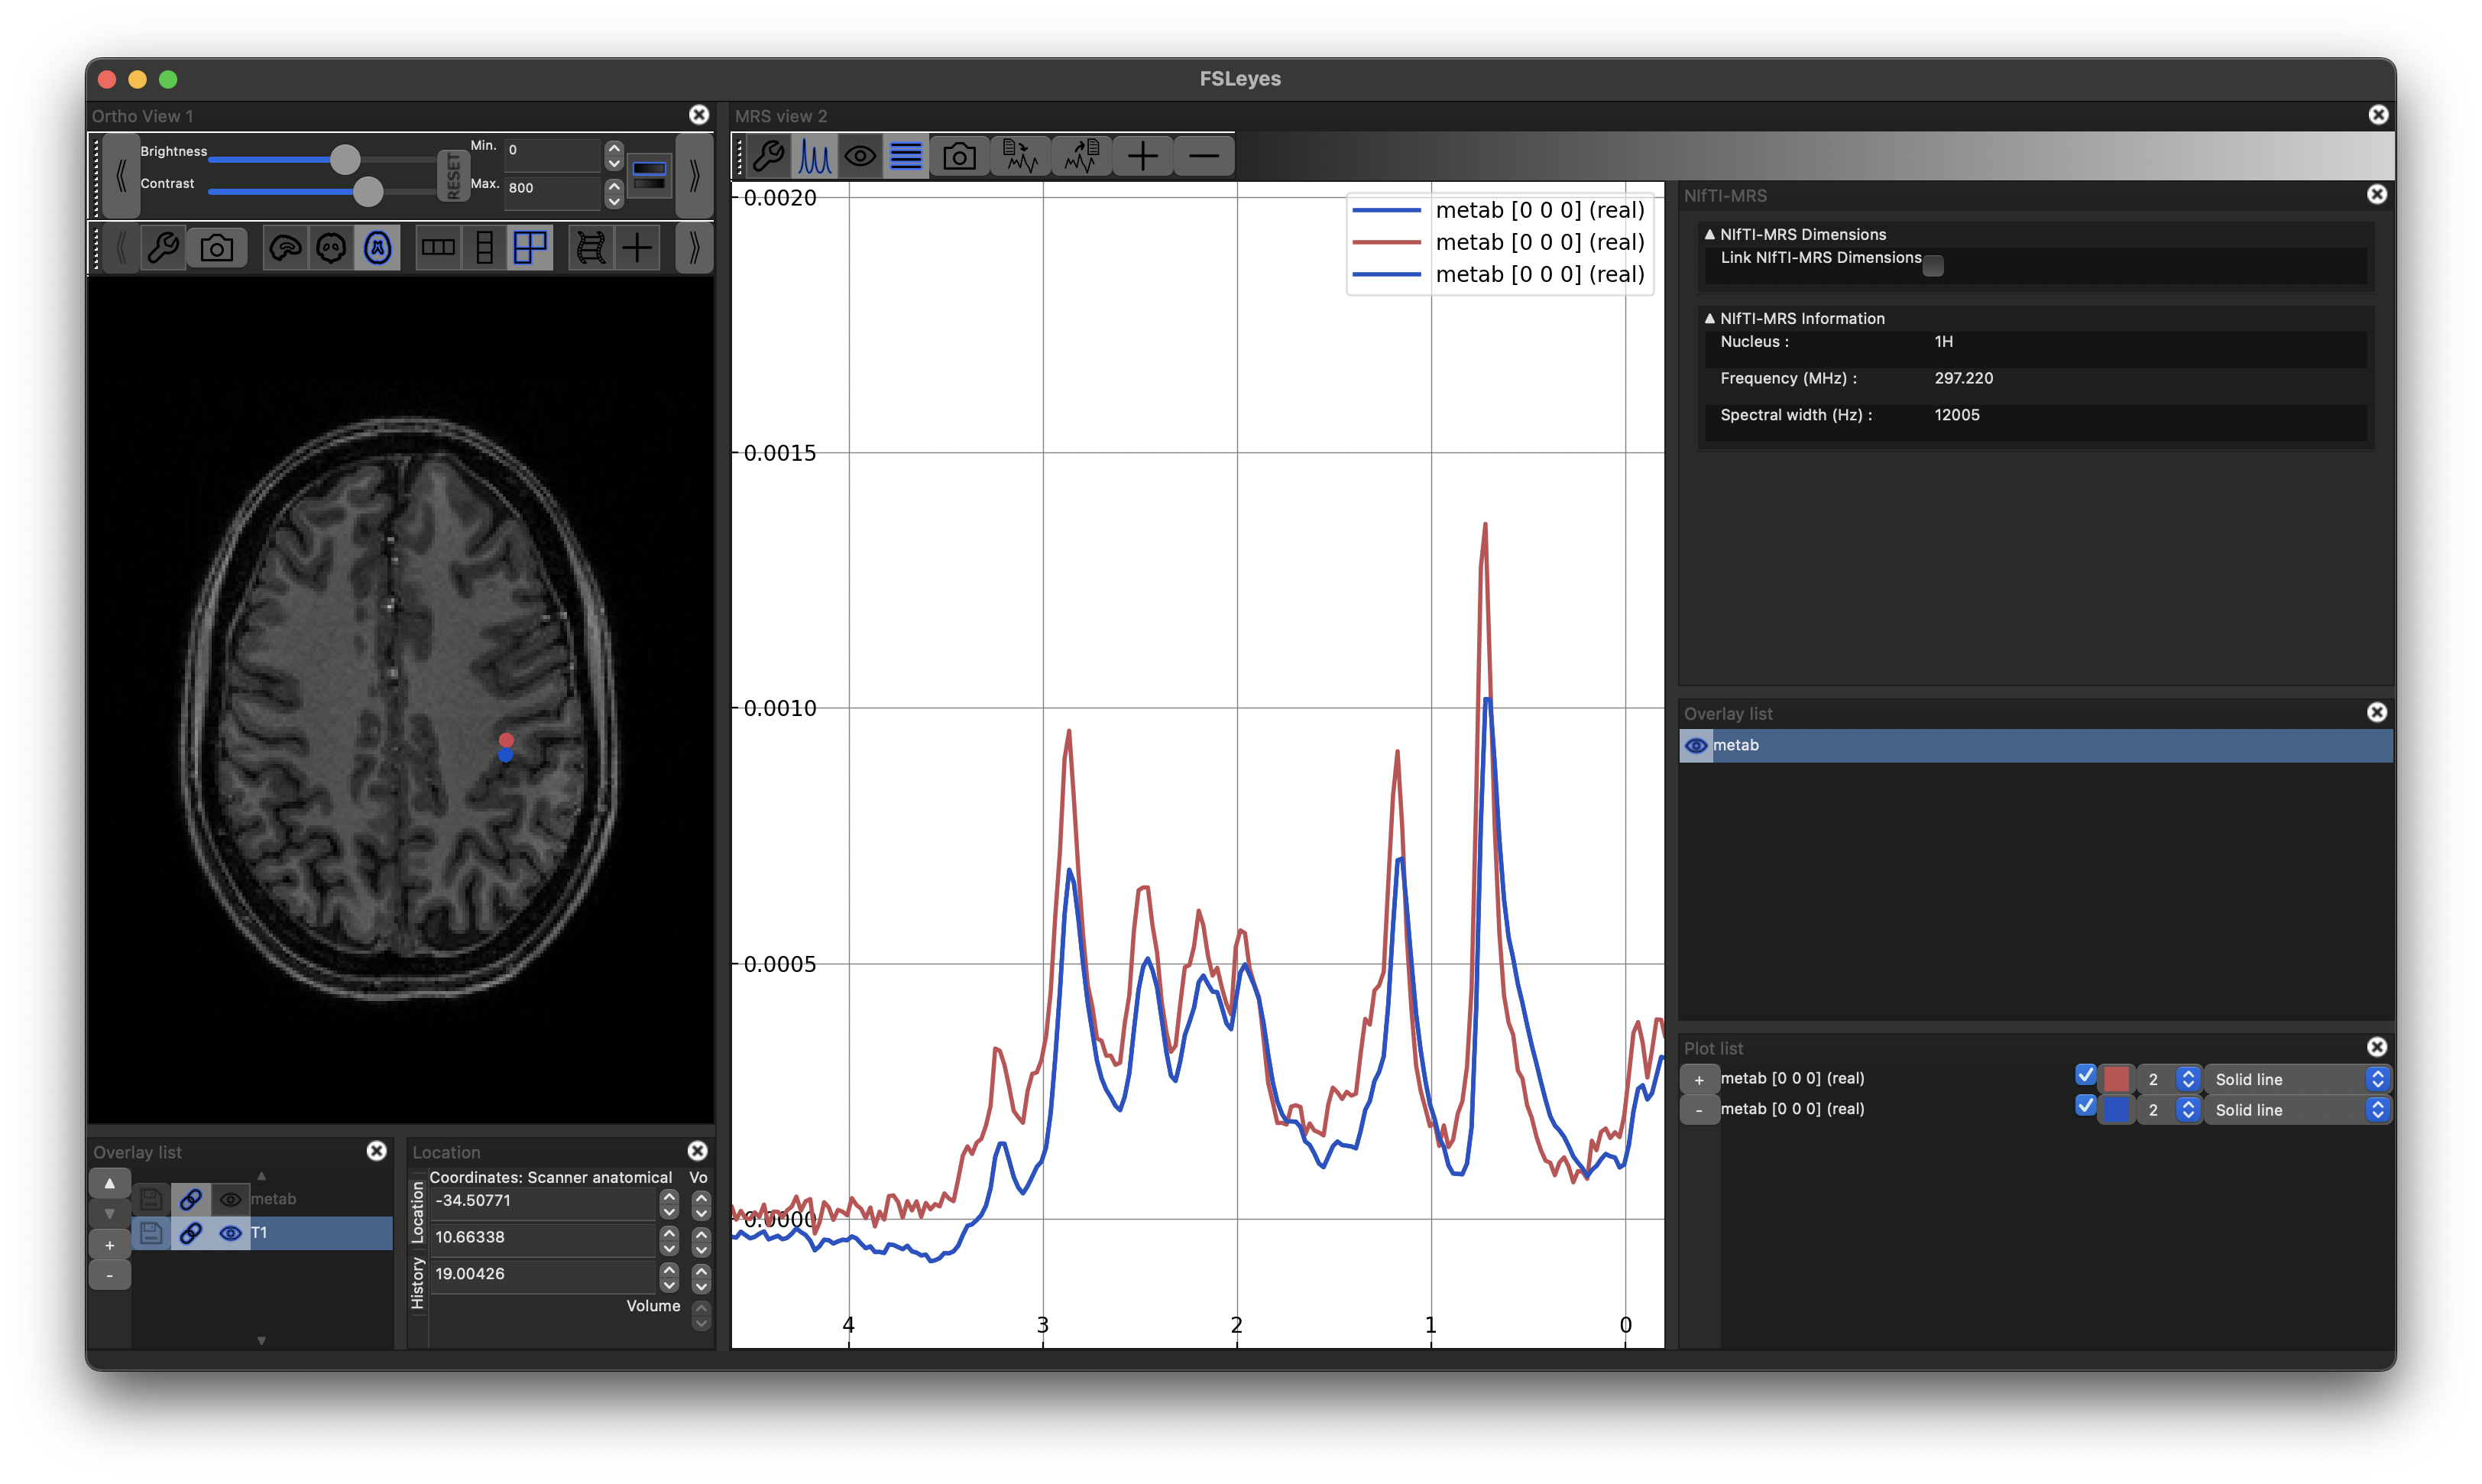
Whenever a spectrum is pinned, an annotation mark will be placed on each view in the orthographic panel marking the spatial origin of the spectrum. The colour of the mark will match (and dynamically update with) that of the spectrum in the MRS view.
The style of mark can be modified using the Annotations panel (Settings -> Ortho view N -> Annotations).
Spectral Range Tool
After loading some MRS(I) data, one may use the Plot Spectral Range in the Tools menu.
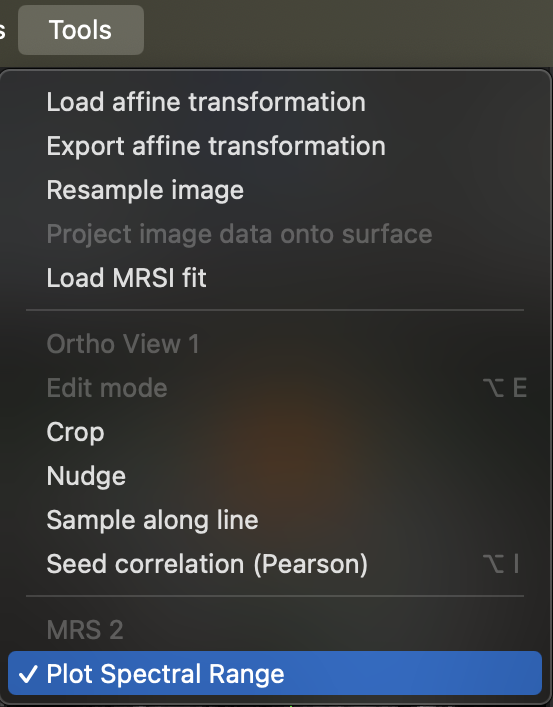
This will open the MRS Range panel.
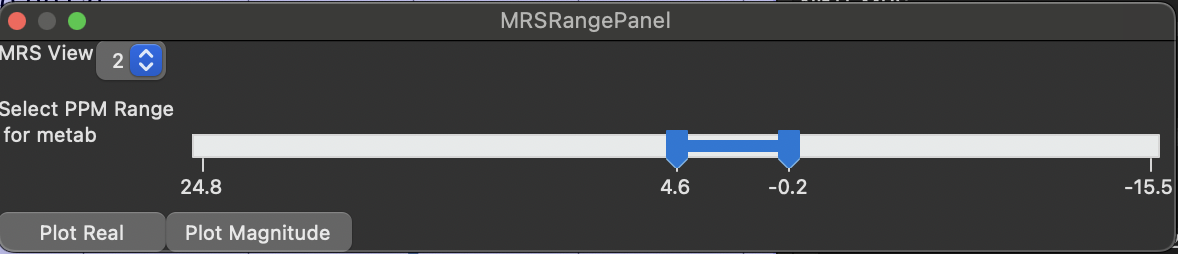
The panel provides sliders to select the ppm range to integrate. Changes in the sliders are interactively shown in the MRS View as a shaded region. There is also a drop-down menu to select between multiple MRS Views, if open. Please note that the panel is associated with the selected overlay in the selected MRS View. If a different spectrum / overlay is desired, then it should be selected via the MRS View Overlay list.
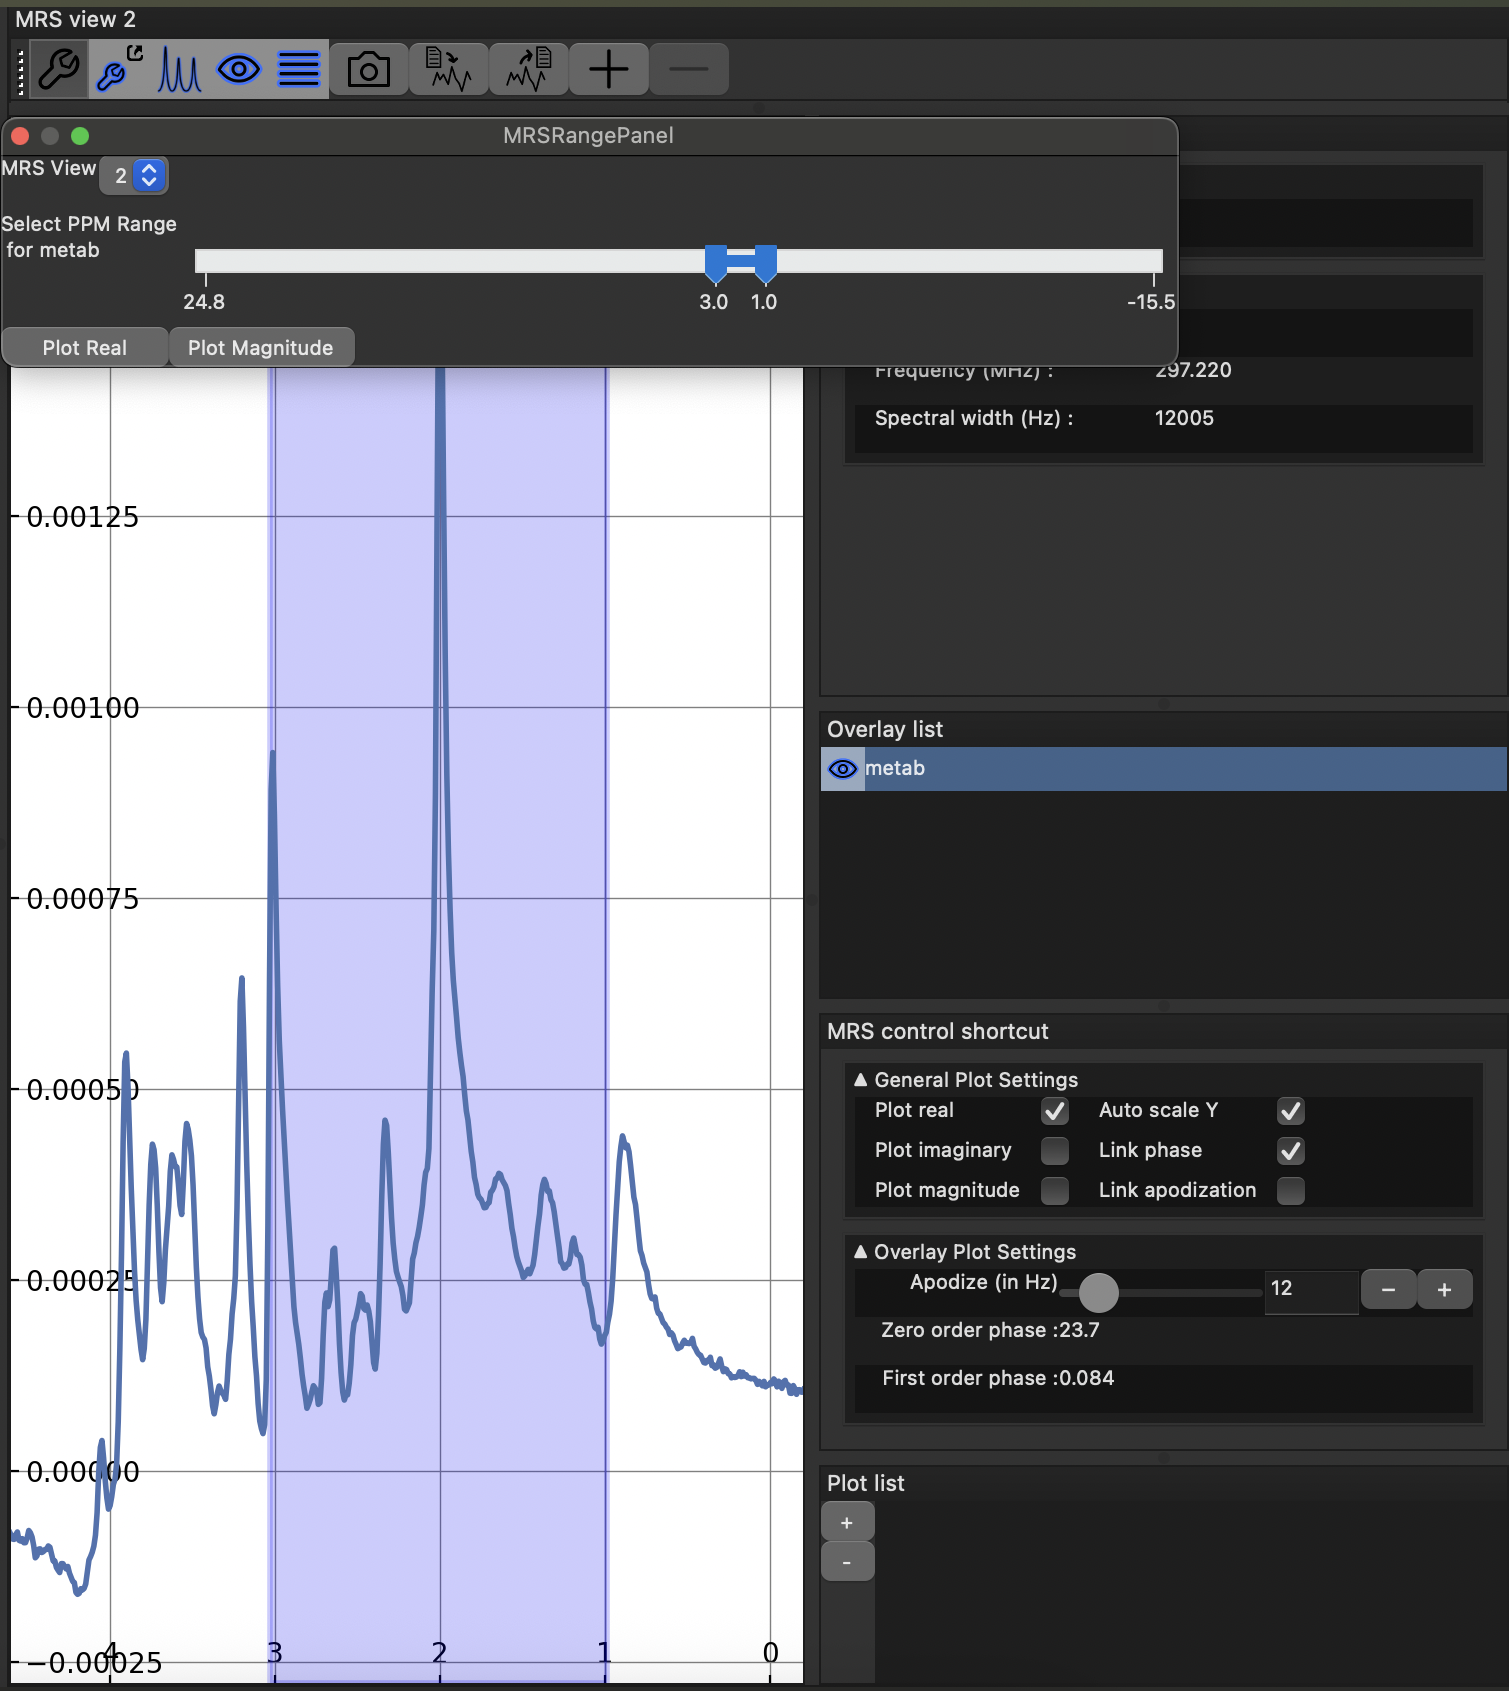
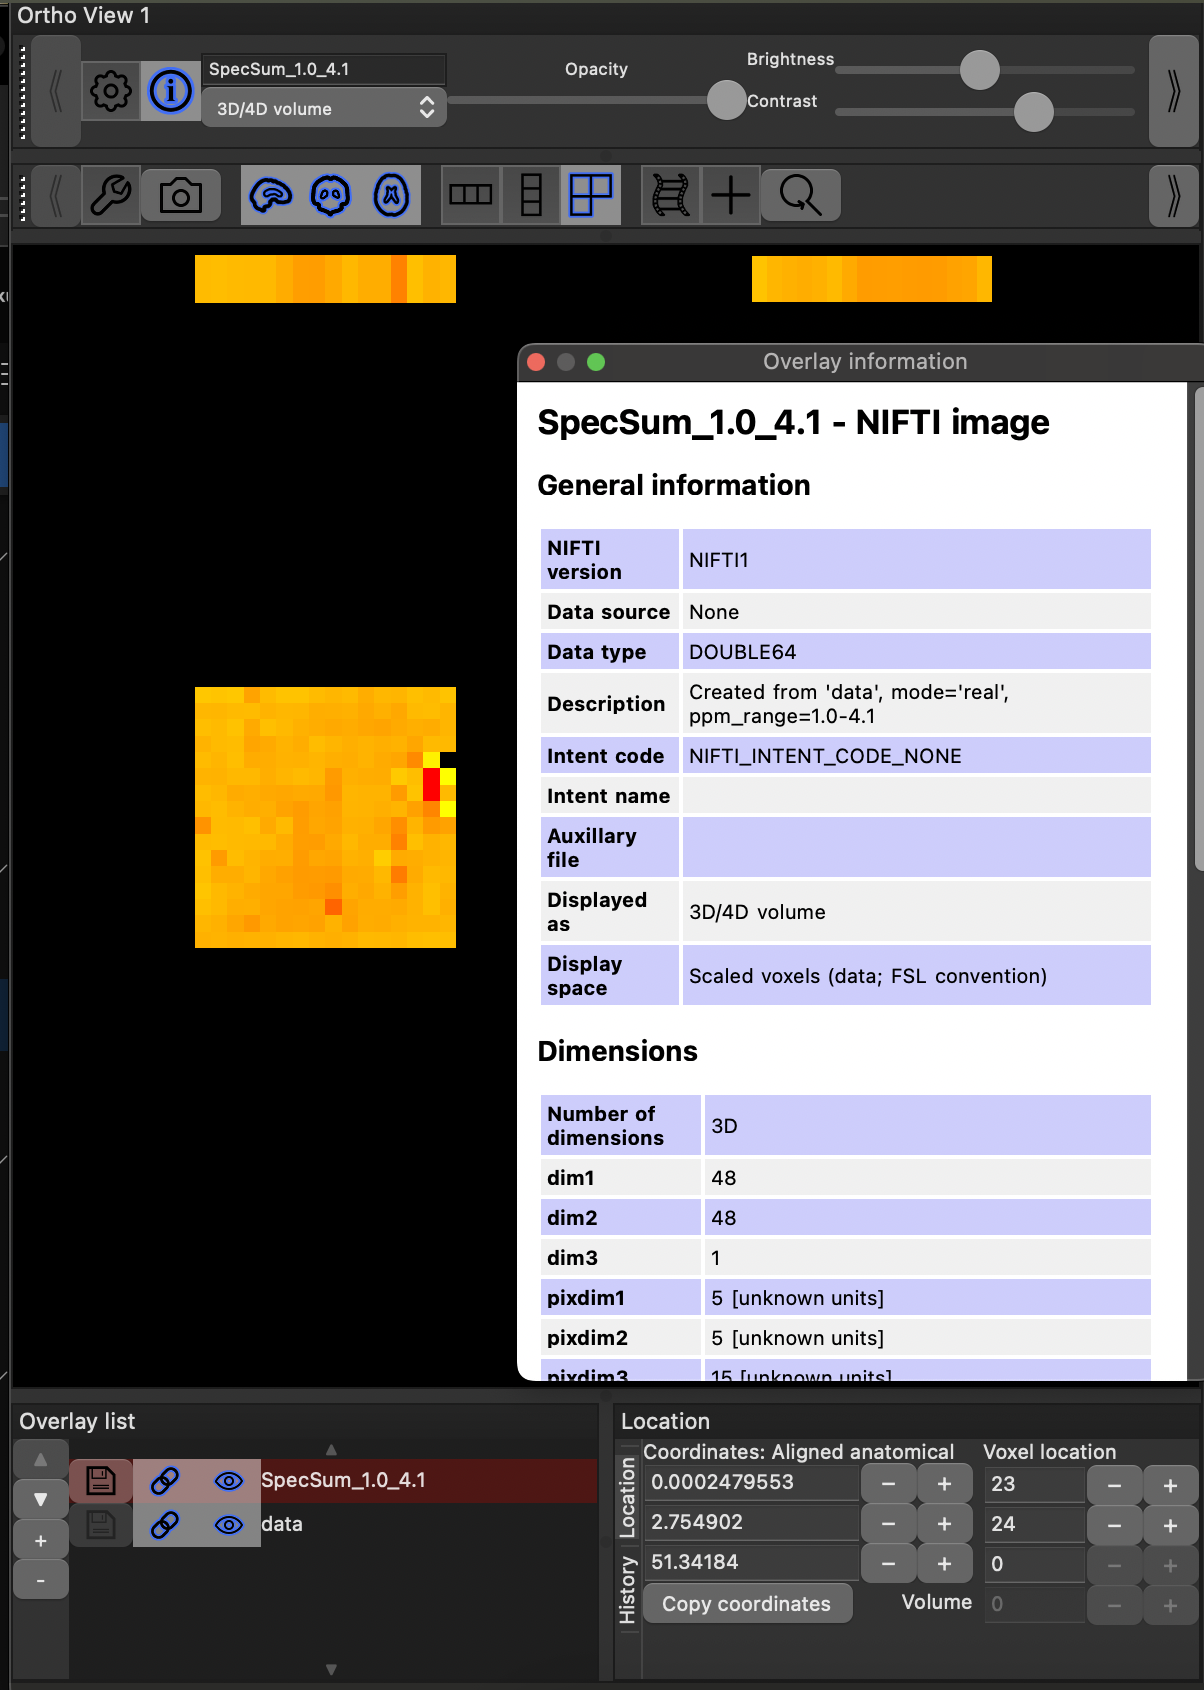
The panel gives the option to integrate and plot the real or the magnitude of the selected spectrum. This will generate a NIfTI overlay shown in the Ortho Panel and named SpecSum_<low_range>_<high_range>. Further details of the user choices can be found in the header’s description field. If desired, the new overlay can be saved into a file by clicking the Save button next to the overlay.