3D view
You can use FSLeyes to view your images, meshes, and tractograms in 3D using the Views ⇒ 3D view menu item.
In the 3D view, the order of overlays in the overlay list does not have any effect on the display - instead, all compatible overlays that you have loaded will be drawn and blended into a single scene, based on their locations in the world coordinate system.
Note
3D visualisation functionality and quality will vary, depending on how you are running FSLeyes, For example, if you are running FSLeyes over a remote SSH/X11 session, quality will be lower, and some features will not be available.
3D view interaction
You can interact with the 3D view in the following ways:
Click and drag to rotate the view
Middle-click, or hold down the ⌥ key and click, to pan the view
Hold down the ⌘ or ⌃ and scroll or spin the mouse wheel to zoom in and out.
Hold down the ⇧ and click to change the display location, relative to the currently selected image or surface.
To reset the view, click on the ![]() button on the toolbar.
button on the toolbar.
3D overlay display settings
The FSLeyes 3D view can display volumetric images, surface meshes, and
streamline tractograms. As with the ortho and lightbox views, you can open the overlay display settings by clicking
on the ![]() button.
button.
Volume overlays
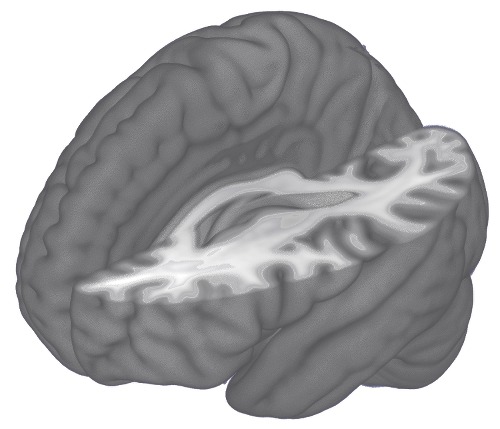
FSLeyes uses a volumetric ray-casting algorithm to display 3D
images. The 3D display settings pane in the overlay display panel (accessed via the ![]() button)
contains settings which allow you achieve higher quality rendering by
controlling the ray casting algorithm.
button)
contains settings which allow you achieve higher quality rendering by
controlling the ray casting algorithm.

It is generally advisable to change the Interpolation setting to Linear or Spline, unless you wish to achieve a Minecraft-style voxel effect.
The following settings can be used to control the ray-casting:
Blending This setting controls the extent to which adjacent samples along each ray are blended together.
Blend by intensity By default, areas of the image with lower voxel intensities will be made more transparent. This setting allows that behaviour to be disabled. When you disable this option, you can use the Clipping range sliders to hide background/low-intensity voxels.
Number of samples This setting controls how many samples are taken through the volume. A higher number of samples will result in a better quality rendering.
Quality This setting controls the resolution of the final rendering. Setting it to 100% will render the result at the display resolution. Reducing this setting will improve the rendering speed - a useful strategy is to reduce the quality, experiment with the other display settings until you are happy, and then increase the quality for the final rendering.
Volume clipping
The 3D display settings pane also contains options to control volume clipping.
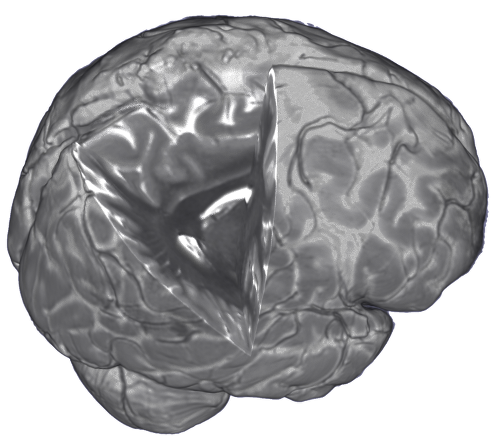
Volume overlays can be clipped by up to five clipping planes. A clipping plane is a flat plane which can be used to divide a volume into two parts - the part of the volume on one side of the plane will be shown, and the part on the opposite side will be hidden.
When more than one clipping plane is active, their effect is combined according to the Clipping mode setting - the default behaviour is to hide the parts of the volume which fall within the intersection of the active planes. You can also choose to hide areas of the volume according to the union, or the complement of the active planes.
When you change the Number of clipping planes setting, a set of additional controls will appear for each clipping plane that you add. The following settings allow you to control each clipping plane:
Clip position This setting controls the position of the plane, as a proportion of the image.
Clip rotation This setting (also known as the azimuth) controls the rotation of the plane about the vertical axis.
Clip Z angle This setting (also known as the incline) controls the rotation of the plane with respect to a horizontal plane.
Mesh overlays
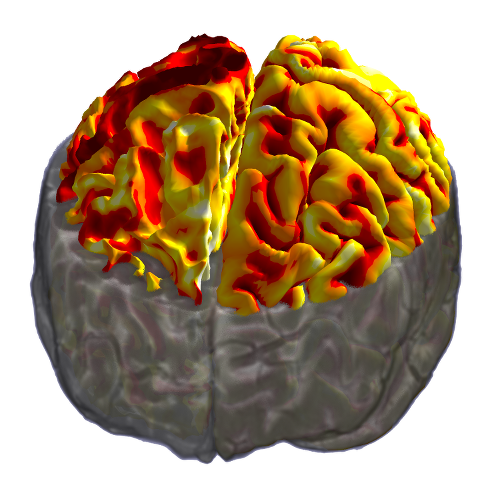
The 3D display settings for mesh overlays are much the same as the 2D display settings. You can choose different variants of the same mesh (e.g. wm, pial, midthickness) via the Surface definition setting, and you can display data on the surface via the Vertex data setting.
If you have an image with data that you would like to display on the mesh, you can use the Tools ⇒ Project image data onto surface option - this will sample data from the image at every mesh vertex, and then add that data to the mesh as a Vertex data option.
The default behaviour, when you are colouring a mesh with some vertex data, is for the colours to be interpolated (smoothed) across the mesh surface. However, if you are viewing discrete data (e.g. anatomical labels), and/or wish to display the mesh with flat, unsmoothed colours, you may change the Interpolation option to Nearest.
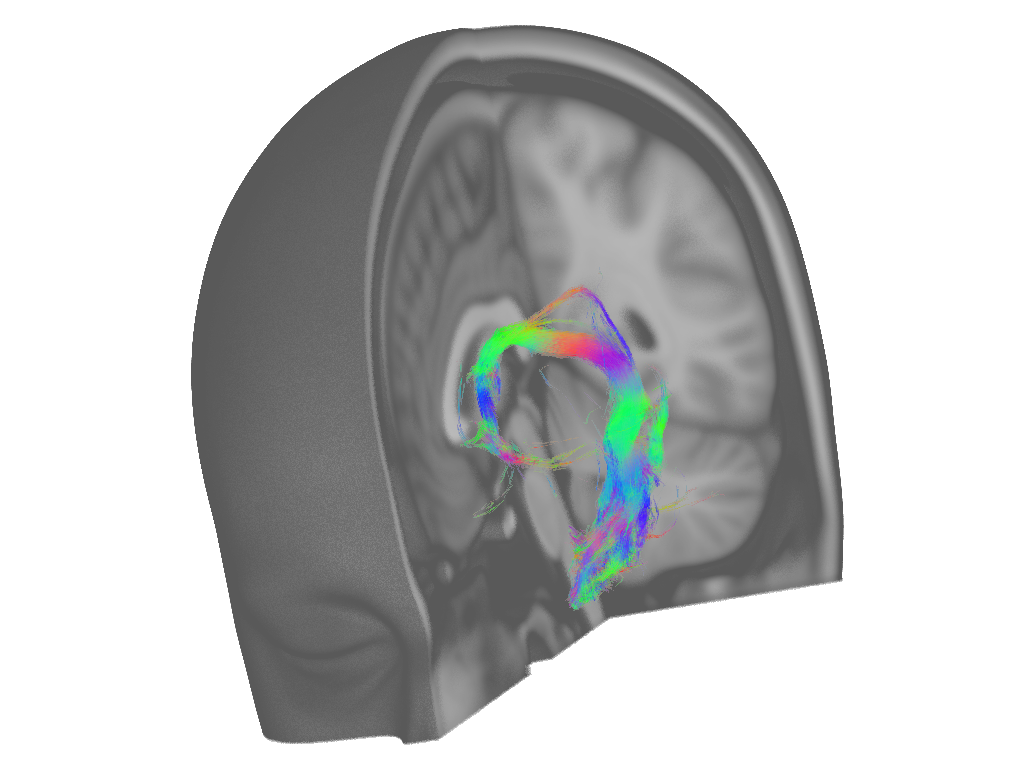
Tractogram overlays
All of the options for displaying tractograms are available in the 3D view. In a 3D view, each streamline is drawn as a line or cylinder.
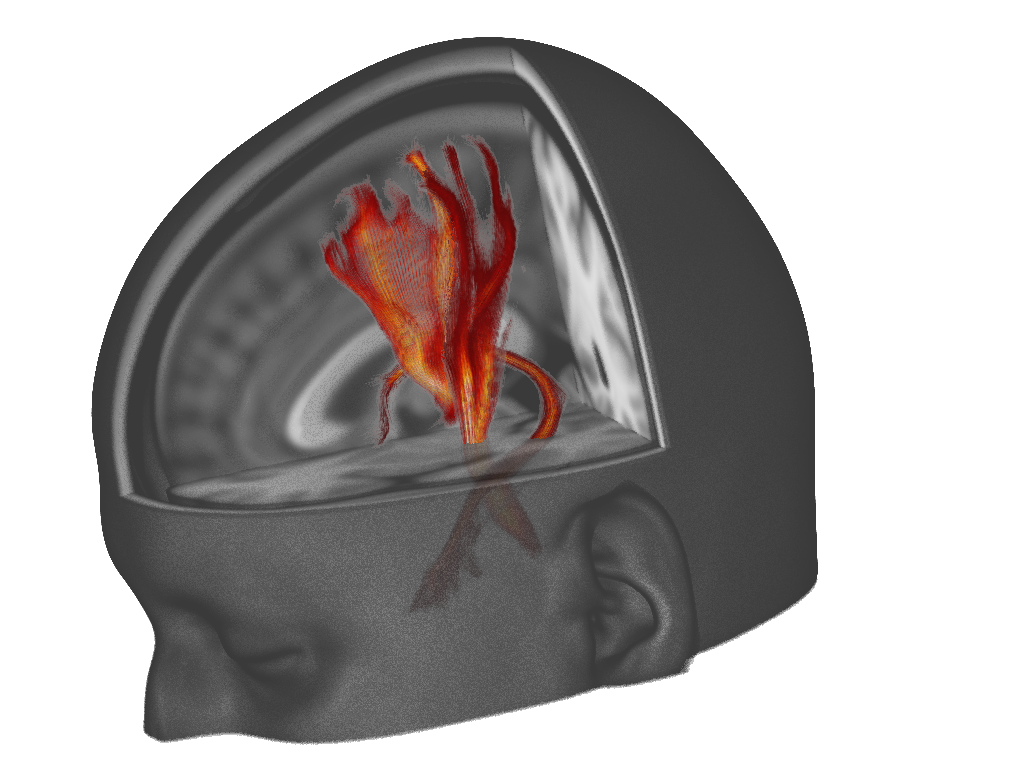
In the 3D view, the Width option controls the thickness of each
streamline. The Resolution option allows you to control whether
streamlines are drawn as lines (lower resolution), or as cylinders (higher
resolution) - when you increase the streamline resolution, a lighting effect
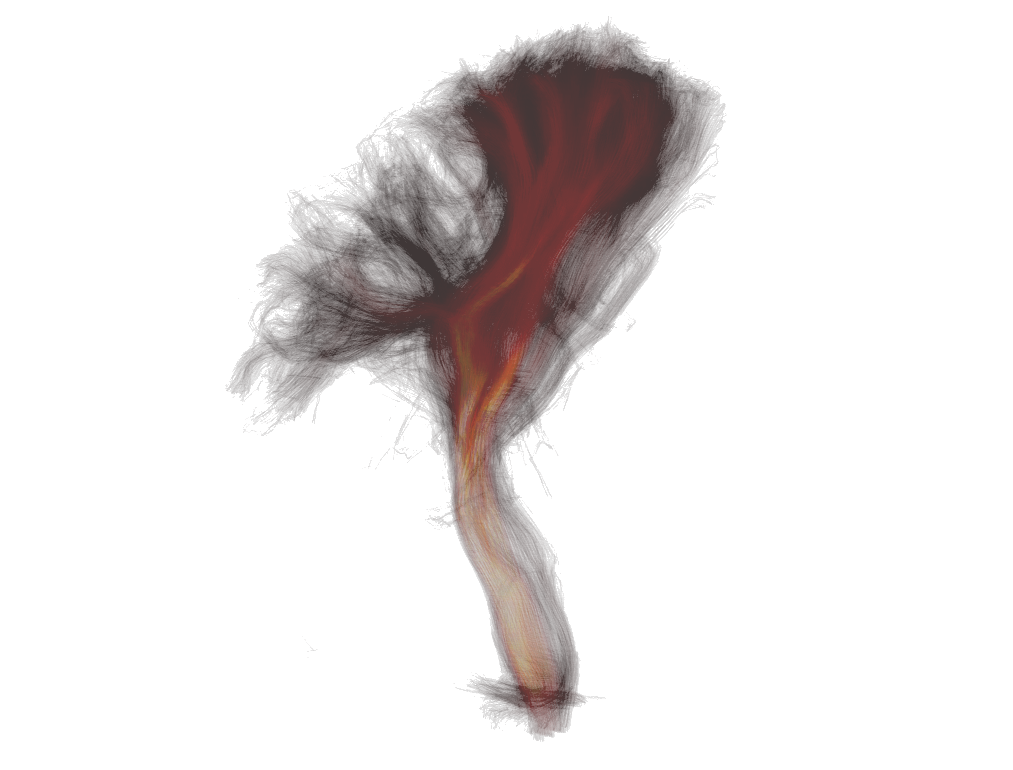
will be applied to the streamlines. Lighting can be disabled in the view
settings dialog (the ![]() button).
button).
It is worth playing with the Opacity setting, as some nice visualisation effects can be achieved.